What are support and resistance?
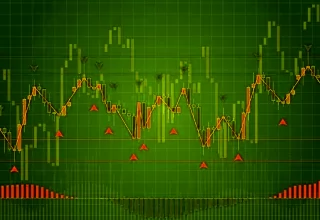
Imagine how the chart looks like when there is a bull market. It sure is going higher, but it will not be a straight line. For sure, it will look like a zigzag, at least. The price will go up and have a slight pullback later on. The highest point before the pullback is called resistance. We know where the surplus of sellers will be when we know the level of resistance. As the price goes up again, the lowest point before the climb is called the support. We know where the surplus of buyers will be once we know the level of support.
So, if we look at the scenario, support and resistance show up whenever the price goes up and down over some given time frame. It is essentially quite the same when there is a bear market or a downtrend. The measurement of the resistance and support is somehow subjective. It may be different from one person to another, but this is a general idea. Traders widely use the concept of support and resistance in trading.
How can we trade resistance and support?
We have two general ways of trading resistance and support, and they are trading the bounce and trading the break. Trade the bounce means buying as the price reaches the support and selling as the price reaches the resistance. On the other hand, trade the break means buying as the price reaches the resistance and selling as the price falls to the support.
How do we plot the support and resistance level?
Support and resistance levels are not definite numbers. They usually look broken and displaced, but you will later realize that the market only tested it out. If you are using a candlestick chart for your technical analysis, then the candlestick shadows represent these tests.
How do we confirm if a support or resistance is broken or not?
Some people say that the support or resistance is broken if the closing price goes beyond that level, but this does not happen all the time. To avoid fake breakouts, take support and resistance as zones and not exact numbers like what we mentioned a while ago.
Here is what you can do: using a line chart, plot the support and resistance since it will only show the closing price. If you want to know if the breakout is real, avoid using candlesticks because they also offer the extreme highs and lows that might confuse you. Only plot the basic and intentional movements. Plot them in the areas where peaks and valleys form.
Did you know?
Once the price gets past resistance, it can become support. More resistance or support level tests mean stronger resistance or support area. If a support or resistance breaks, the follow-through’s strength will depend on how strong the support or resistance held.
Too complex, is it?
This may sound a bit complex and hard to understand but know that everyone starts as beginners. You will appreciate this with a little more practice and knowledge.
Source: https://www.babypips.com/learn/forex/support-and-resistance


